Copyright © 2006 by ReedyRiver Group LLC. All rights reserved.
Applying Pareto's Principle to Project Estimates
In 1906, an Italian economist Vilfredo Pareto developed data that indicated that 80% of his country’s wealth was owned by 20% of the populace. Others subsequently noticed an 80/20 rule applied to many kinds of phenomena. This has evolved into a general principle that can be stated as follows:
- Eighty percent of a result is caused by twenty percent of the cases.
- A corollary is eighty percent of the cases affect only 20% of the result.
Although Pareto did not actually state this principle, it is usually attributed to him, and so we will follow tradition. Here are some examples of the principle.
- A business finds that 20% of its clients provide 80% of their business.
- An engineering and construction company finds that 20% of its projects provide 80% of its profits.
- IT Desktop Services personnel find that 80% percent of their time is spent helping 20% of their customer base.
How can this principle be applied?
Using our first example above, if 20% of your clients provide 80% of the profits you might ask, “How much of total sales effort is focused on this top tier of clients?” If you find that your sales effort is evenly divided, then you might increase business by focusing more effort on the top tier or develop a strategy to increase the number of top tier clients. If the sales effort is heavily focused on the top tier, then you might increase business by focusing more sales effort on some of the lower tier of clients. You might find that 80% of your sales effort is focused on clients representing 20% of your business.
How can this principle be applied to project estimating?
Let’s see if we can apply the principle to project estimating. Remember that the principle states that eighty percent of a result is caused by twenty percent of the cases. Let’s restate it and its corollary into hypotheses that fit our purpose.
- Eighty percent of the estimated project cost is represented by 20% of the items in the estimate.
- Only twenty percent of our effort is spent estimating the activities that represent 80% of the project cost.
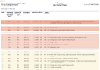
Let’s test our hypothesis. First arrange your estimate items by total cost of the item and in descending order. Next calculate each item’s percent of total project cost and the accumulated percent of total cost. Draw a line beneath the item that represents 80% plus or minus of the total project cost.
Ranking your estimate items by cost and looking at the percent of total cost that each item represents is an interesting exercise by itself. Profit, resource requirements, and risk are usually proportional to cost. You may notice a few large cost items that do not have very much detail. These may need to be broken down into smaller component activities to increase your confidence in the estimate.
Now look at the number of estimate items above and below the 80% cost line. Chances are that less than half of your estimate items are above the 80% line. Remember our corollary to Pareto’s Principle? Have you spent 80% of your time estimating 20% of the cost?
When refining your estimate, either to reduce estimated cost or reduce risk, the activities above the line are where you need to focus your attention.
A cost spectrum is even more interesting.
An estimate cost spectrum is the same idea but with lines drawn to divide the estimate into 25%, 50%, and 75% cost spectra. To improve the effect, each area is shaded. Let’s look at an example.
The following is a link to an example of an All Cost Spectrum Analysis Report™ created by @estimate™:
 .: Example: Internet System Development Cost Spectrum Report (pdf file size: 9 KB)
What do you think?
Questions and comments can be sent to:

@estimate and Cost Spectrum Analysis Report are trademarks of ReedyRiver Group LLC.